Thirty web pods on k3s with Docker and Podbag
by 
 @SteelCrabon in Benchmarks, EngineeringPermalink
How long does a deployment take to become ready? Does runtime choice still matter once the application serves traffic? We ran the same two-tier workload on one k3s node and changed its container runtime.
What we measured
Six web pods proxy requests through a Kubernetes Service to 24 API pods. Each API returns its own pod name. A client on the node calls the web Service’s ClusterIP. A response counts only if it has status 200 and the body identifies an API pod.
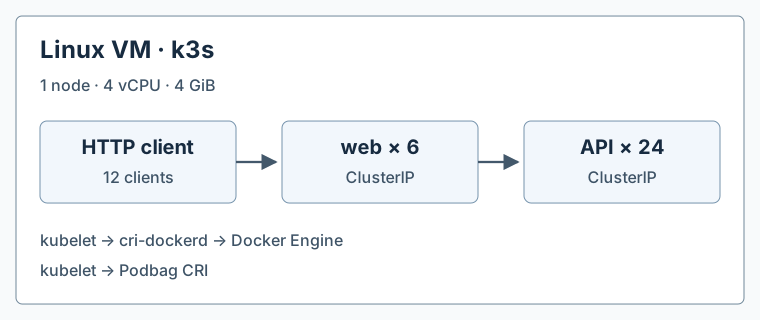
Both tiers use the same NGINX image and HTTP readiness probes. Each container requests 20m CPU and 16 MiB of memory, with limits of 200m and 48 MiB. K3s uses its bundled cri-dockerd adapter for Docker Engine and the native CRI socket for Podbag.
Ubuntu 26.04.1 LTS · Linux 7.0.0-43-generic · ARM64 · 4 vCPU · 4 GiB · k3s v1.37.2+k3s1 · Docker Engine 29.1.3 · Podbag c0ff5eb
Results
Data table
| Metric | Docker Engine | Podbag |
|---|---|---|
| All 30 pods ready | 3.39 s | 2.48 s |
| HTTP p95 at fixed load | 1.41 ms | 1.26 ms |
| HTTP p95 during burst | 3.46 ms | 3.69 ms |
| Successful requests/s during burst | 7,019 | 6,330 |
| Validated responses | 33,600 / 33,600 | 33,600 / 33,600 |
The median rollout on this node took 0.91 s less with Podbag. At 240 requests/s the per-run p95 ranged from 1.20–1.60 ms with Docker and 0.93–1.88 ms with Podbag. All 24 API pods answered in every trial. Docker had the higher median throughput during the short burst. The per-run throughput ranges overlapped.
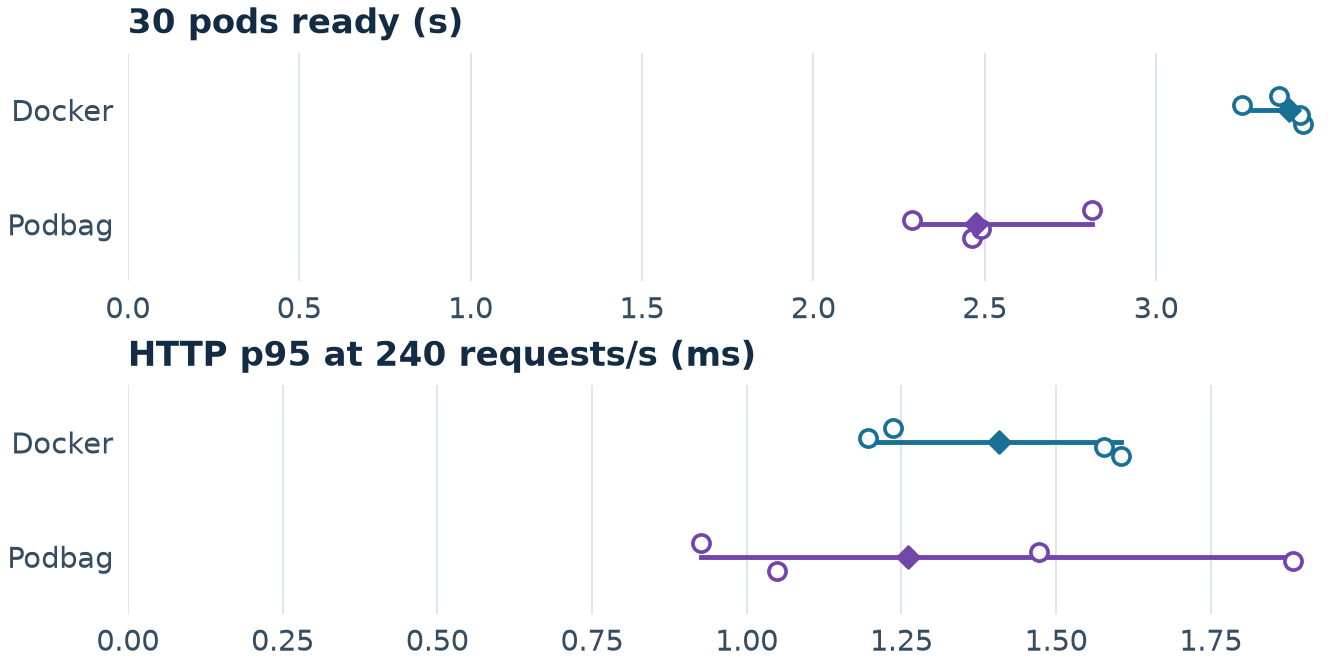
The readiness timer starts immediately before the first scale request. We poll every 100 ms until the two Deployments report 30 ready replicas. We then verify 30 ready endpoints and wait two seconds. Twelve clients each issue 100 requests over fresh TCP connections. The p95 is the time within which 95% of successful requests completed.
After the burst we waited two seconds. The same 12 clients then issued 20 requests per second each for about 30 seconds, targeting 240 requests per second in total. We computed p95 separately for the two phases.
Block order was Docker → Podbag → Podbag → Docker. Each block had one warm-up and two timed runs. The table gives the median of four runs per runtime and the total successful responses across those runs. Images were warm. The load client shared the VM’s CPUs. The API returned a short response. Database work and external network latency are outside this measurement.
These figures describe rollout and HTTP service on a single node. The burst rate includes the client and network path. The burst is too short to estimate sustained maximum throughput.
Why the image reference mattered
In a pilot with the multi-architecture NGINX index and IfNotPresent, Podbag already held the ARM64 image, but a CRI lookup by index digest missed. The kubelet retried pulls and hit its pull rate limit. For the measured runs we verified the ARM64 manifest digest on both engines and used imagePullPolicy: Never. We rebooted the VM and created a fresh cluster for each block.
An AWS deployment
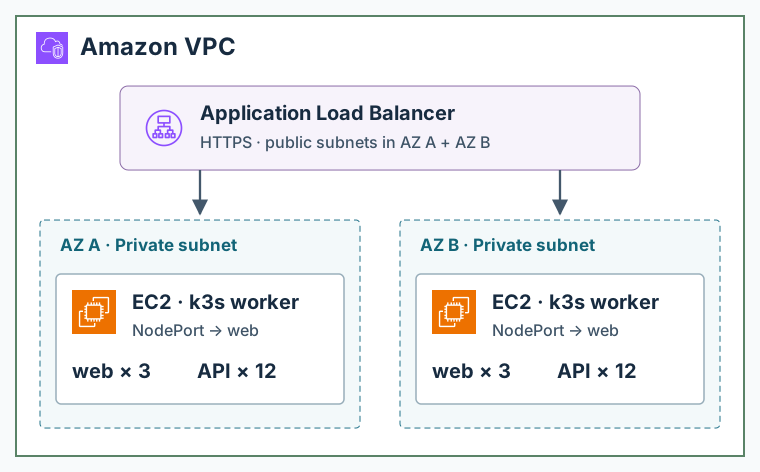
An internet-facing Application Load Balancer spans public subnets in two Availability Zones. It forwards HTTPS traffic to the web Service’s NodePort on EC2 workers in private subnets. Label the workers with topology.kubernetes.io/zone. Apply a spread constraint on that key to each Deployment to place three web and twelve API replicas per zone. Keep the API Service internal with ClusterIP. The figure traces application traffic.
AWS Application Load Balancer · AWS Architecture Icons
Reproduce the run
Workload · Measurement script · Per-run data · Node configuration and run order · start-node.sh